
Spreadsheets help us to solve our day to day problems with the help of its features. It uses complicated formulas to solve the calculations. If we want a more efficient solution, then we use pivot tables and charts in our spreadsheet.
The Pivot tables and charts help us to compare and analyze large amounts of data easily. You can display your database in a more effective way by using this tool. The Pivot chart is helpful in getting a graphical representation of the database.
This article talks about pivot charts and tables and how to use them in the best possible way in a sheet.
There are some things essential to have to use a pivot chart and table. To use a pivot table you need a list of data items that consist of rows and columns. Calc also offers us functions to sort the database. Calc recognizes the lists automatically. It checks the selected cell in all four directions. You must select one cell to sort, filter, and use the pivot table.
How to create a pivot table?
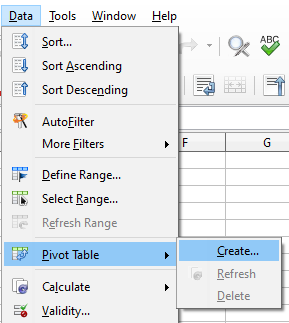
Follow these steps to create a pivot table:
- Click on Data.
- Now, click on the pivot table.
- Click on create.
- It is present on the menu bar.
- Click on insert.
- Select the pivot Table option.
You can also add a pivot table by clicking on the icon of the insert pivot table. It is present on the standard toolbar.
Using the pivot table dialog
The function of implementing the pivot table in a spreadsheet is controlled at two places. The pivot table dialog box and the manipulations of the data in a spreadsheet control the function of the pivot table.
To use the pivot table dialog box right-click on the area of results on the pivot table. A context menu appears on the screen. Select the edit layout option.
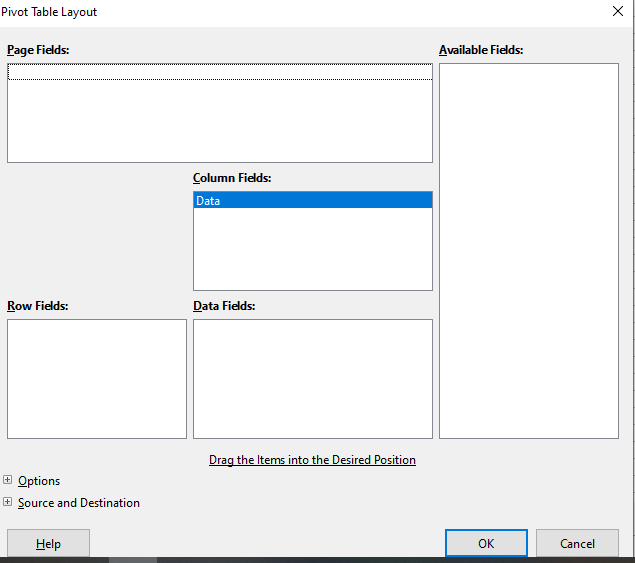
The Basic layout of a pivot table:
A pivot table has four major areas. They are:
- Page fields
- Column fields
- Row fields
- Data fields
There is one more area also available apart from these four areas in a pivot table which is Available Fields. It contains the name of fields. To choose any one of it, drag and drop the required field. It is mandatory for the data field to contain at least one field.
Pivot charts
A pivot chart helps us to get a graphical representation of the results and information on the pivot table. There are many features by which the pivot charts and other charts differ in Calc. The differences are:
- If there are any changes done in the pivot table the same changes get reflected in the pivot charts.
- Other charts in calc adjust the series of data accordingly.
- The Pivot chart buttons are present on the pivot chart only. These buttons are unique to the pivot chart. They are not present in the Calc charts.
Creating a pivot chart
The steps to create a pivot chart are –
- Click inside the pivot table.
- Select the insert option.
- Click on the chart.
- It is present on the menu bar.
You can also click on the insert chart option present on the standard toolbar.
Editing a pivot chart
If you want to change the appearance or size of the pivot chart inserted then you can do it very easily. Calc provides us with many features to edit a pivot chart. You can change the font size, font colors, and chart type by using the options provided by calc.
Deleting a pivot chart
To delete the chart, just select the pivot chart and press the del key. When we delete any pivot chart, the pivot table is not at all affected. But when you delete a pivot table, then the computer automatically deletes the corresponding pivot chart also.
How to update a pivot chart?
To update or refresh a pivot chart follow the following steps:
- Select the data option.
- Click on the pivot table.
- Click on the refresh option.
Thus, with these all options of pivot charts and pivot tables, we can get the desired output from the database.
Conclusion
These are some basic functions and options of using pivot tables and charts in a spreadsheet. You can easily use them and change your database. These features help you to analyze your database more efficiently. Hence, the pivot table and charts are one of the most important features of the Nebula Office.